
World’s Strongest Currencies Ranked:Trading High-Value Forex Pairs
Understanding the Relative StrengthIndex (RSI)

Mastering Bull and Bear Markets: APractical Guide for Traders
bet365 Casino Games & Slots Apps on Google Play
Understanding the Relative StrengthIndex (RSI)

The Relative Strength Index (RSI) is one of the most widely used technical indicators in trading. Known for its simplicity and effectiveness, RSI helps traders assess market momentum and identify potential overbought or oversold conditions.
Whether you are new to technical analysis or refining an existing strategy, understanding how RSI works can improve timing, discipline, and decision-making when trading on MetaTrader 5 (MT5).
What Is the Relative Strength Index (RSI)?
The RSI is a momentum oscillator developed by J. Welles Wilder Jr. in 1978. It measures the speed and magnitude of recent price movements to evaluate whether an asset is trading at extreme levels.
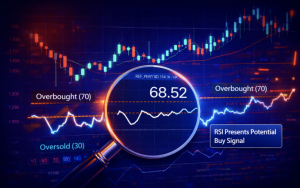
RSI is displayed as a line oscillating between 0 and 100.
Key RSI Levels
- Above 70 (Overbought): Price may be overextended and vulnerable to a pullback
- Below 30 (Oversold): Price may be undervalued and due for a rebound
Why RSI Matters in Trading
Important to note:
- Overbought does not always mean “sell. ”
- Oversold does not always mean “buy”
- RSI works best when combined with price action, trend analysis, and other indicators
How RSI Is Calculated
RSI = 100 – [100 / (1 + RS)]
Where:
- RS (Relative Strength) = Average Gain ÷ Average Loss
Default Setting
- 14 periods (standard across most platforms, including MT5)
Adjusting RSI Periods
- Shorter periods (7–9): More responsive, faster signals, higher noise
- Longer periods (21+): Smoother signals, fewer false positives
Most traders start with the default setting and adjust only after gaining experience.
How to Use RSI in Trading
1. Overbought and Oversold Signals
- RSI above 70 suggests buying momentum may be weakening
- RSI below 30 suggests selling pressure may be fading
Confirmation using candlestick patterns or support and resistance improves reliability.
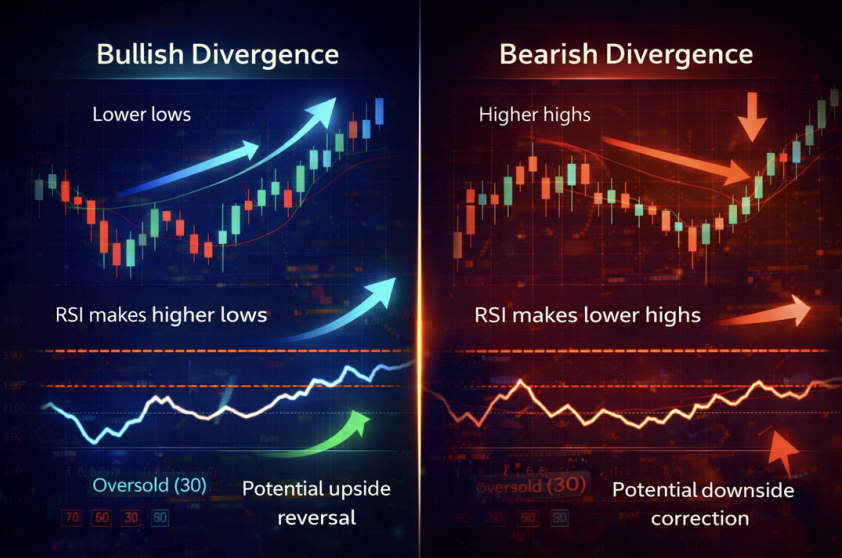
2. RSI Divergence
- Bullish Divergence:
- Price makes lower lows, RSI makes higher lows
- → Potential upside reversal
- Bearish Divergence:
- Price makes higher highs, RSI makes lower highs
- → Potential downside correction
3. The 50-Level (Trend Confirmation)
- RSI holding above 50 often confirms bullish momentum
- RSI holding below 50 often confirms bearish momentum
Using RSI to Identify Trends
In Uptrends
- RSI typically ranges between 40 and 90
- Pullbacks often find support near the 40–50 zone
In Downtrends
- RSI usually ranges between 10 and 60
- Rallies often stall near the 50–60 zone
Customizing RSI for Different Trading Styles
Short-Term Trading
- RSI Period: 7 or 9
- Faster signals for day trading and scalping
- Higher chance of false signals
Swing or Position Trading
- RSI Period: 14–21
- Smoother signals
- Better suited for trend-following strategies
Adjusting Thresholds
- Volatile markets: 80/20
- Stable markets: 70/30
Combining RSI with Other Indicators
- Moving Averages: Confirm overall trend direction
- Bollinger Bands: Validate price extremes
- MACD: Confirm momentum shifts and reversals
Advantages and Limitations of RSI
The Relative Strength Index (RSI) is easy to understand and apply, making it a popular tool for momentum analysis. It is effective for identifying overbought and oversold conditions, spotting divergence, and is readily available on all MT5 charts.
However, RSI has limitations: it can produce false signals in strongly trending markets and is not predictive when used on its own. Proper context and confirmation are essential, and understanding these limitations helps traders avoid over-reliance on the indicator.
Final Thoughts
The Relative Strength Index remains one of the most reliable and widely used indicators in technical analysis. When applied correctly, RSI helps traders understand momentum, identify potential reversals, and confirm trend strength.
By combining RSI with disciplined risk management and other technical tools on MT5, traders can build more structured and informed trading strategies with BWG.