Mastering Bull and Bear Markets
Learn how market cycles work and how traders adapt strategies during bullish and bearish conditions.

The Relative Strength Index (RSI) is one of the most widely used technical indicators in trading. Known for its simplicity and effectiveness, RSI helps traders assess market momentum and identify potential overbought or oversold conditions.
Whether you are new to technical analysis or refining an existing strategy, understanding how RSI works can improve timing, discipline, and decision-making when trading on MetaTrader 5 (MT5).
The RSI is a momentum oscillator developed by J. Welles Wilder Jr. in 1978. It measures the speed and magnitude of recent price movements to evaluate whether an asset is trading at extreme levels.
RSI is displayed as a line oscillating between 0 and 100.
These levels do not predict reversals on their own; rather, they act as contextual signals.
RSI functions as a momentum gauge, helping traders understand whether buying or selling pressure is strengthening or weakening.
In strong trends, RSI can remain overbought or oversold for extended periods.
RSI compares the average gains and losses over a set number of periods using the formula:
RSI = 100 – [100 / (1 + RS)]
Where: RS (Relative Strength) = Average Gain ÷ Average Loss
14 periods (standard across most platforms, including MT5)
Most traders start with the default setting and adjust only after gaining experience.
Confirmation using candlestick patterns or support and resistance improves reliability.
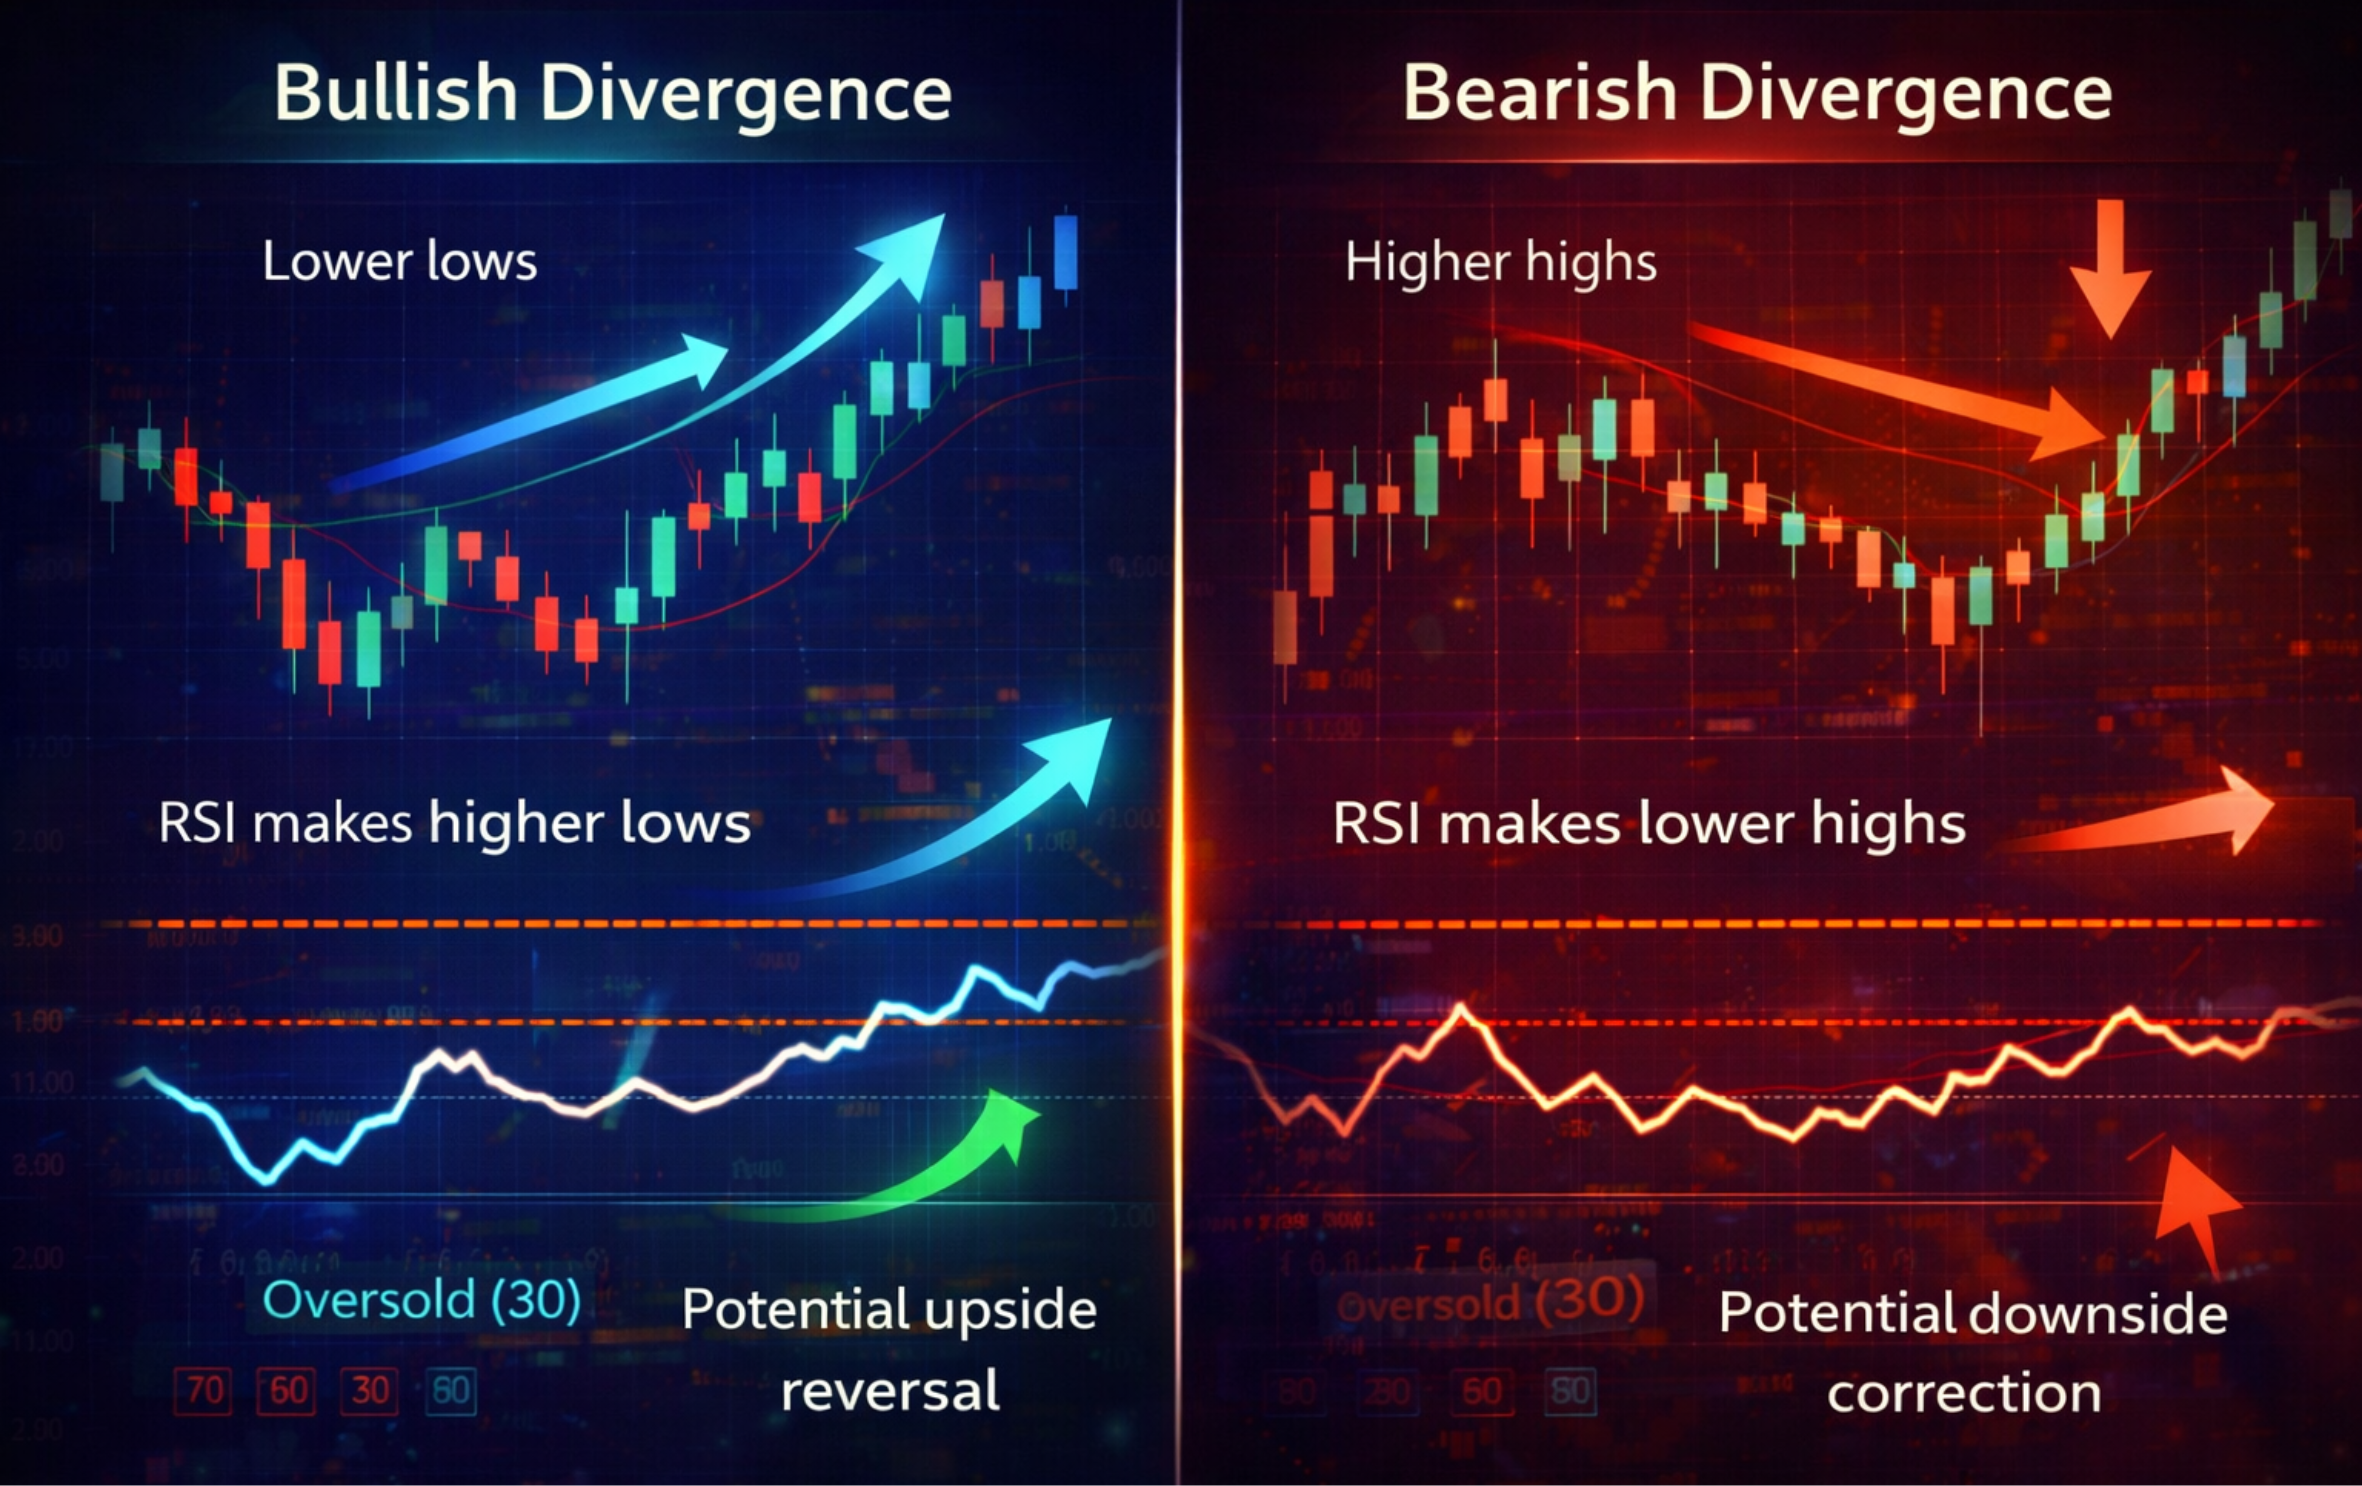
Divergence occurs when price and RSI move in opposite directions, often signalling a loss of momentum.
Bullish Divergence:
Price makes lower lows, RSI makes higher lows → Potential upside reversal
Bearish Divergence:
Price makes higher highs, RSI makes lower highs → Potential downside correction
Divergence is most effective near key market levels.
Crosses of the 50-level can signal shifts in market bias.
Recognising these ranges helps traders avoid counter-trend entries.
RSI should be part of a system, not a standalone trigger.
The Relative Strength Index (RSI) is easy to understand and apply, making it a popular tool for momentum analysis. It is effective for identifying overbought and oversold conditions, spotting divergence, and is readily available on all MT5 charts.
However, RSI has limitations: it can produce false signals in strongly trending markets and is not predictive when used on its own. Proper context and confirmation are essential, and understanding these limitations helps traders avoid over-reliance on the indicator.
The Relative Strength Index remains one of the most reliable and widely used indicators in technical analysis. When applied correctly, RSI helps traders understand momentum, identify potential reversals, and confirm trend strength.
By combining RSI with disciplined risk management and other technical tools on MT5, traders can build more structured and informed trading strategies with Best Wing Global.