Platforms – PLATFORMS AND FEATURES – Trading charts
Trading charts
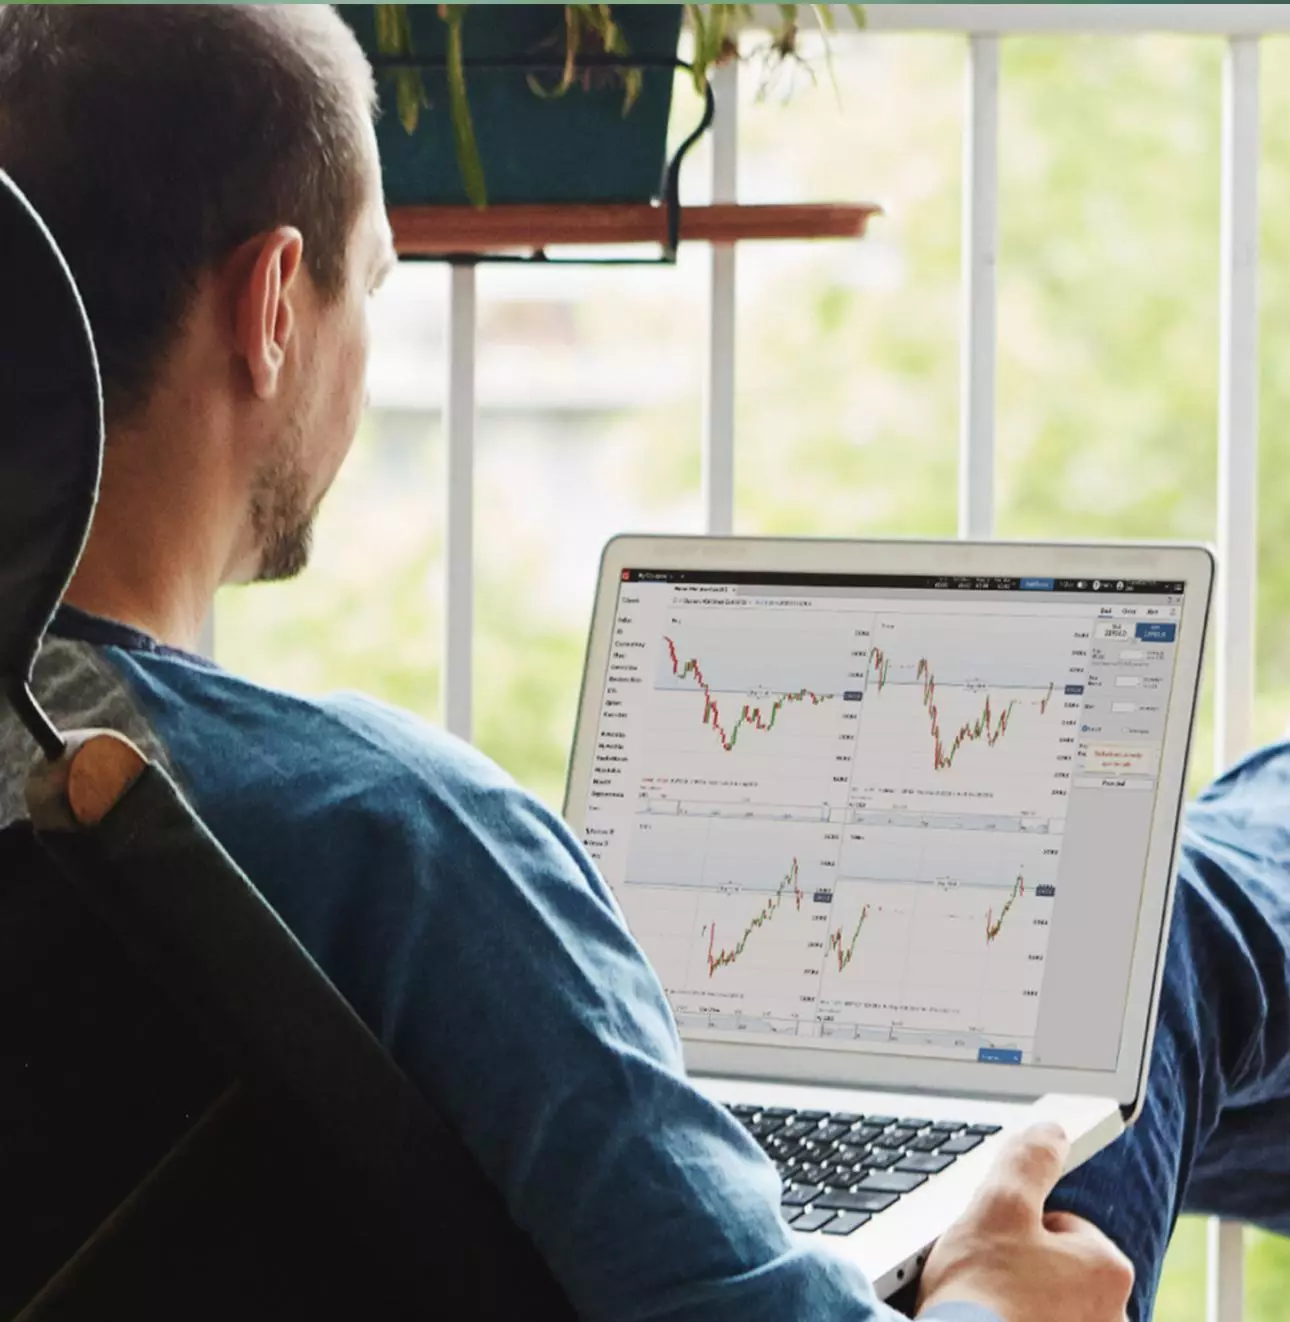
Get to the heart of price action with our free, live trading charts for forex, shares, indices, cryptos and more. Perform in-depth analysis with 25 indicators and 17 drawing tools.
Start trading today. Call +971 (0) 4 5592108 or email sales.ae@ig.com. Our sales team is available from 8:00am to 6:00pm (Dubai time), Monday to Friday.
Why download our trading app?
Trade at the cutting edge
Take advantage of lightning-fast HTML5 technology and watch market developments in real time2
Trade at the cutting edge
Perform in-depth technical analysis with the help of 25 customisable indicators and 17 drawing tools
Trade at the cutting edge
Keep informed with a curated news and analysis feed – plus, add notable dates, like earnings seasons
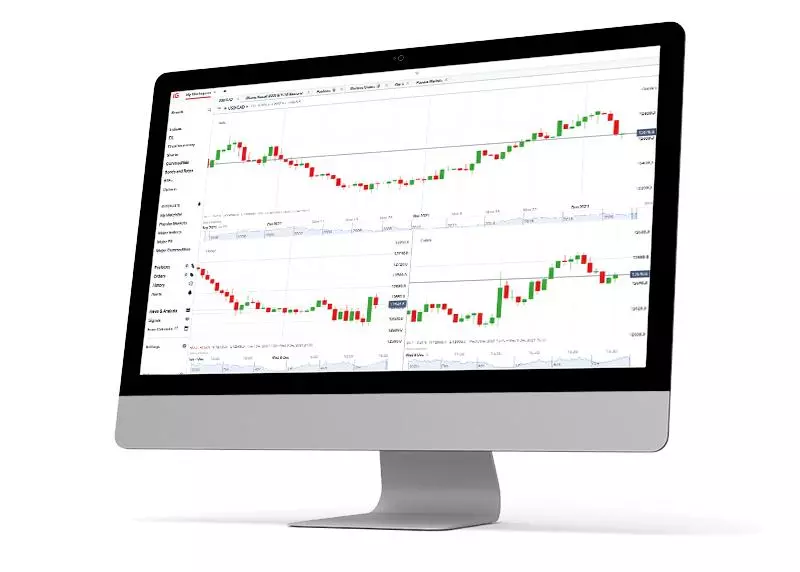
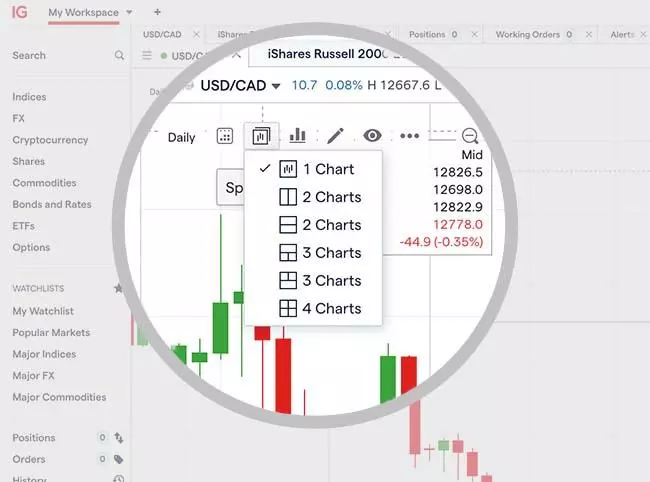
See the full picture across multiple timeframes with our graphs
Compare the same market across multiple timeframes with our innovative chart-splitting feature. Split charts up to four times, and apply the layout that best fits your needs.
With a clear view of different periods, from tick-by-tick to monthly, you’ll be in the best possible position to identify – and react to – significant price movements.
In-depth chart analysis with 25 indicators and 17 drawing tools
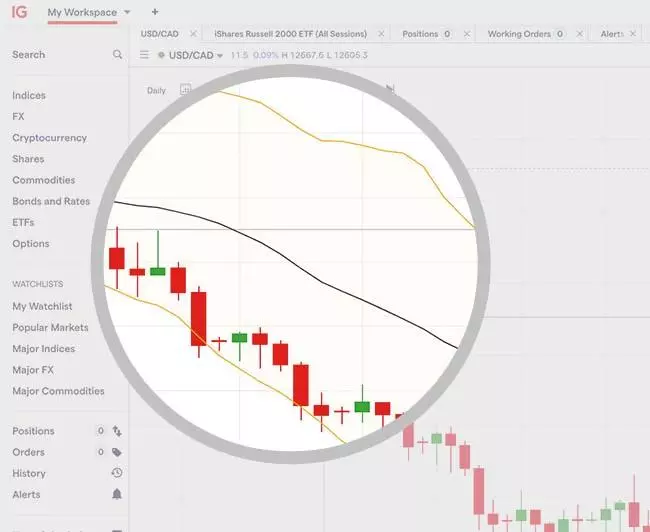
Indicators
Make informed trades using state-of-the-art technical analysis tools. With our award-winning platform,2 you’ll have access to Bollinger Bands, the MACD, pivot points and many others.
Add indicators to a selected price chart easily by clicking on the ‘indicators’ icon on the chart. Alternatively, right click and select ‘indicators’ from the menu bar. Remember, past performance doesn’t guarantee future results.
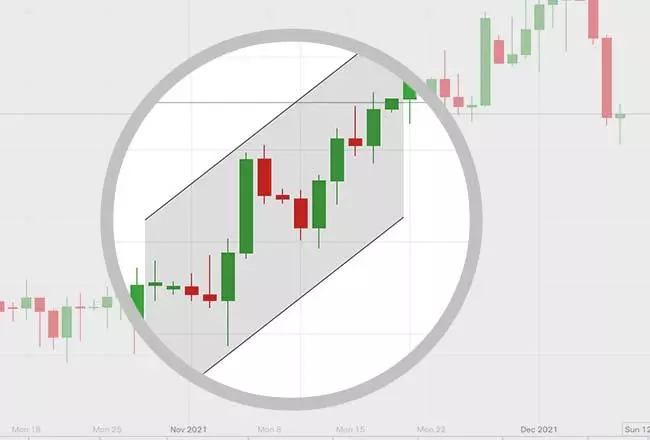
Drawings
Identify and visualise trends, triangles and wedges, among other important chart patterns with drawings.
Select the object you want from the ‘drawings’ icon on the chart (or right click on the chart and select ‘drawings’ from the menu). Our drawing objects include Fibonacci retracements and extensions, Elliott waves, channels and more.
Lightning-fast live graphs
Enjoy an effortless trading experience with our HTML5 technology. You can split charts, apply as many indicators as you like and add your own annotations, all without sacrificing speed or stability.
Our charts are designed to perform on any browser – though we recommend Google Chrome for the very best experience.
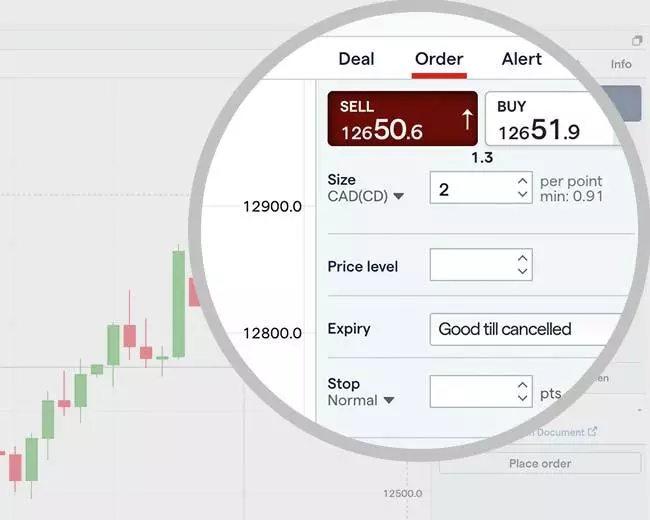
Trade directly from your charts
React to new opportunities faster than ever by trading directly from charts. Open, close and edit positions in a couple of clicks with our easy-to-use functionality. And, choose one-click trading to take positions instantly.
Our platform is designed to make it as quick as possible for you to respond to key market movements – especially from our charts.
Open an account now
Fast execution on a huge range of markets
Enjoy flexible access to 17,000 global markets, with reliable execution
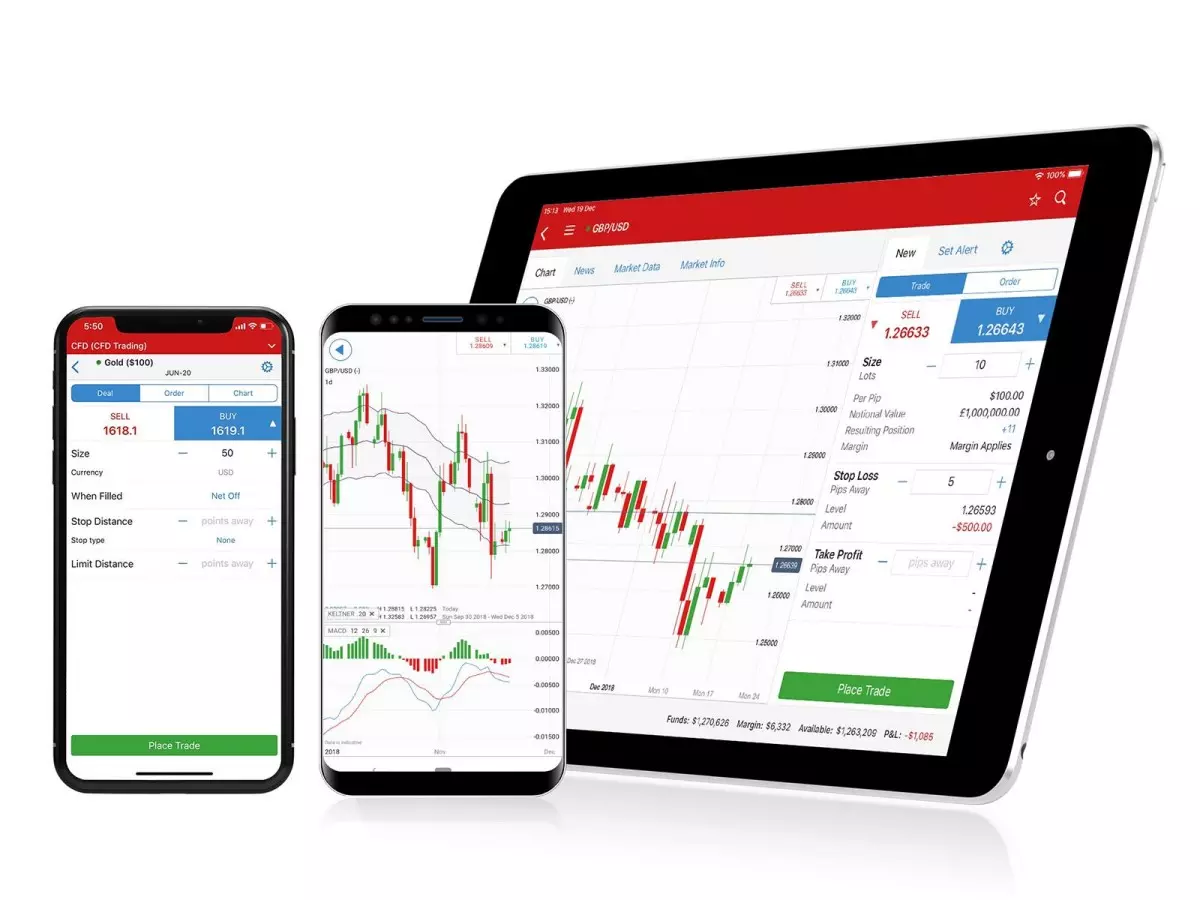
Deal seamlessly, wherever you are
Trade on the move with our natively designed, award-winning trading app*
Feel secure with a trusted provider
With more than 45 years of experience, we’re proud to offer a truly market-leading service
*Best Finance App, Best Multi-Platform Provider and Best Platform for the Active Trader as awarded at the ADVFN International Financial Awards 2024.
What are the types of trading charts and how do you read them?
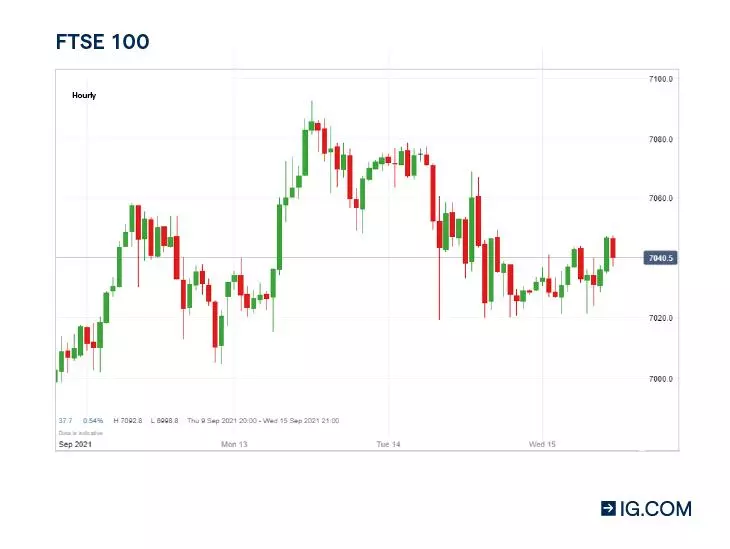
Candlestick charts display pricing information in long, thin bars that resemble candles. Each candlestick shows price movement over the period of time you selected. A green candlestick indicates that the market moved up in price over the given period, closing at a higher price than it opened. A red candlestick, on the other hand, indicates that the market’s price decreased, closing at a lower price than it opened.
Candlesticks give you information about four key price variables:
Open – the price at the start of the period
Close – the price at the end of the period
High – the highest price traded during the period
Low – the lowest price traded during the period
The relationship between the four prices shown by a candlestick can tell you a great deal about how market conditions are shaping up and who’s driving the price action: buyers or sellers.
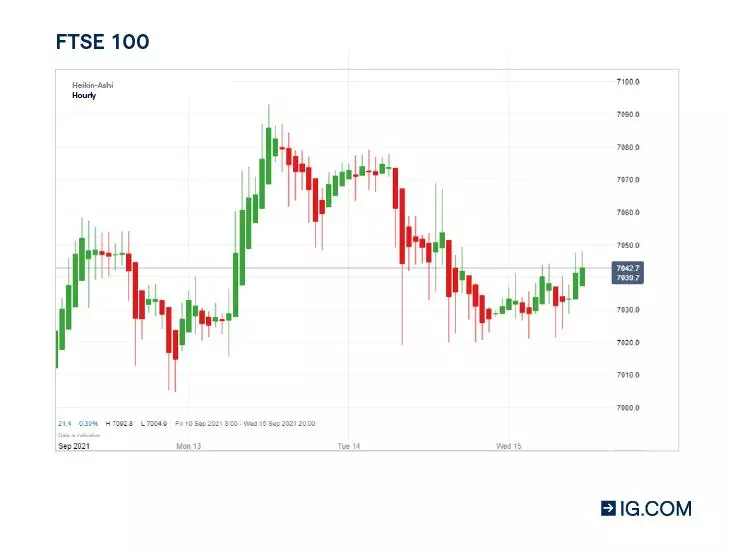
On first encounter, Heikin-Ashi bars may look very similar to the candlestick chart. But, there’s a significant difference between the two. Heikin-Ashi, which more or less translates from Japanese as ‘average pace’, gives you an indication of price averages – and their changes – over a period.
Heikin-Ashi charts are smoother than candlesticks and, rather than offering an exact price at any moment, are often looked to for determining general trends over longer timeframes. The opening price of a Heikin-Ashi bar is the mid-point of the previous bar, and the closing price equals the average price for the current period.
In short, each Heikin-Ashi bar shows you the direction and magnitude of every period’s change in average price level. For example, a long green bar will indicate that the average price has increased substantially. Conversely, a long red bar tells you that the average price in the market has dropped significantly.
The next type of chart, HLOC, which stands for ‘high, low, open, close’, shows the same data as a candlestick chart, but in a different way:
The open price is represented by the horizontal notch to the left of the vertical line
The close price is represented by the horizontal notch to the right of the vertical line
The high price is the uppermost point of the vertical line
The low price is the lowest point of the vertical line
Once again, the line will be green if the market moved up over the given period, closing at a higher price than it opened. It’ll be red if the asset’s price decreased over the given period, closing at a lower price than it opened. In the instance that the market opens and closes at the same level, a chart formation known as a ‘doji’ will be shown. Doji’s look like crosses, and because neither green nor red can be applied, they’ll appear in black.
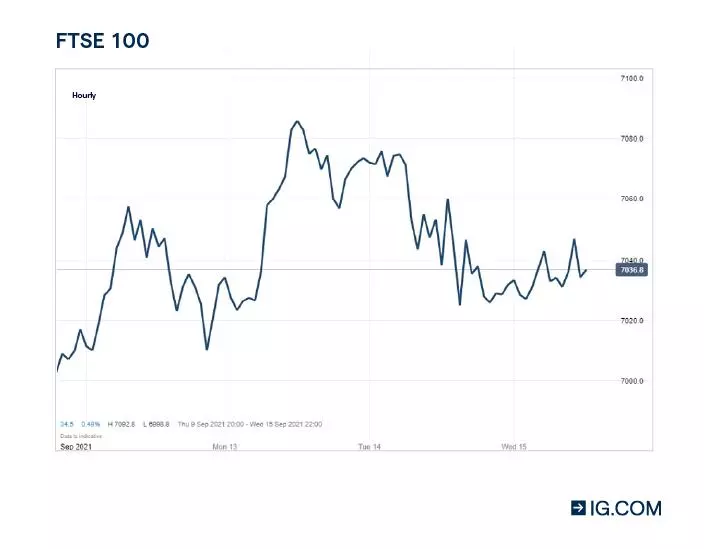
Unlike a candlestick or HLOC chart, a line chart only shows the close price for the time period you have selected (eg, one hour). The close prices are joined together so that the consecutive points form a line.
This is a very simple way to display pricing data as it doesn’t give any indication of what the high, low or open price for the period was. For this reason, many traders only use line charts when assessing long-term trends, where some of the additional information may not be quite as relevant as it is when trading short-term patterns.
When trading short-term volatility, such as in a highly liquid forex market, you’ll want to know the extent and pace of price movements, as well as the exact price of the market at any given moment – meaning that a candlestick or HLOC bar chart will be a better source of data.
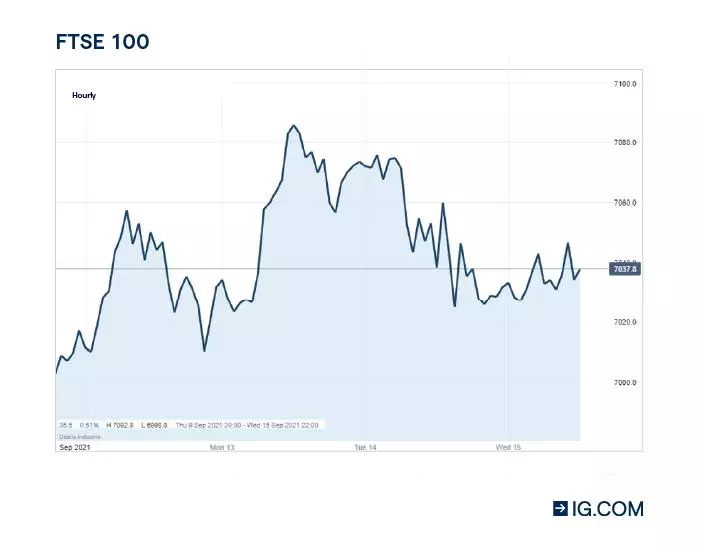
The final type of chart is a mountain chart. This is the same as a line chart, except the area beneath the line is shaded, giving it the appearance of a mountain in silhouette. Like line charts, this type is mainly used to assess long-term trends, as the high, low, and open prices for each period aren’t on show.
The shaded ‘mountain’ gives you a quick impression of the shape of the market and its volatility – frequent peaks and valleys, with steep gradients, indicate higher levels of volatility, while smoother gradients suggest more stability.
Technical indicators that are drawn directly onto charts – Bollinger Bands, for example – may be to read when applied to mountain or line charts than candlesticks and HLOC bars.
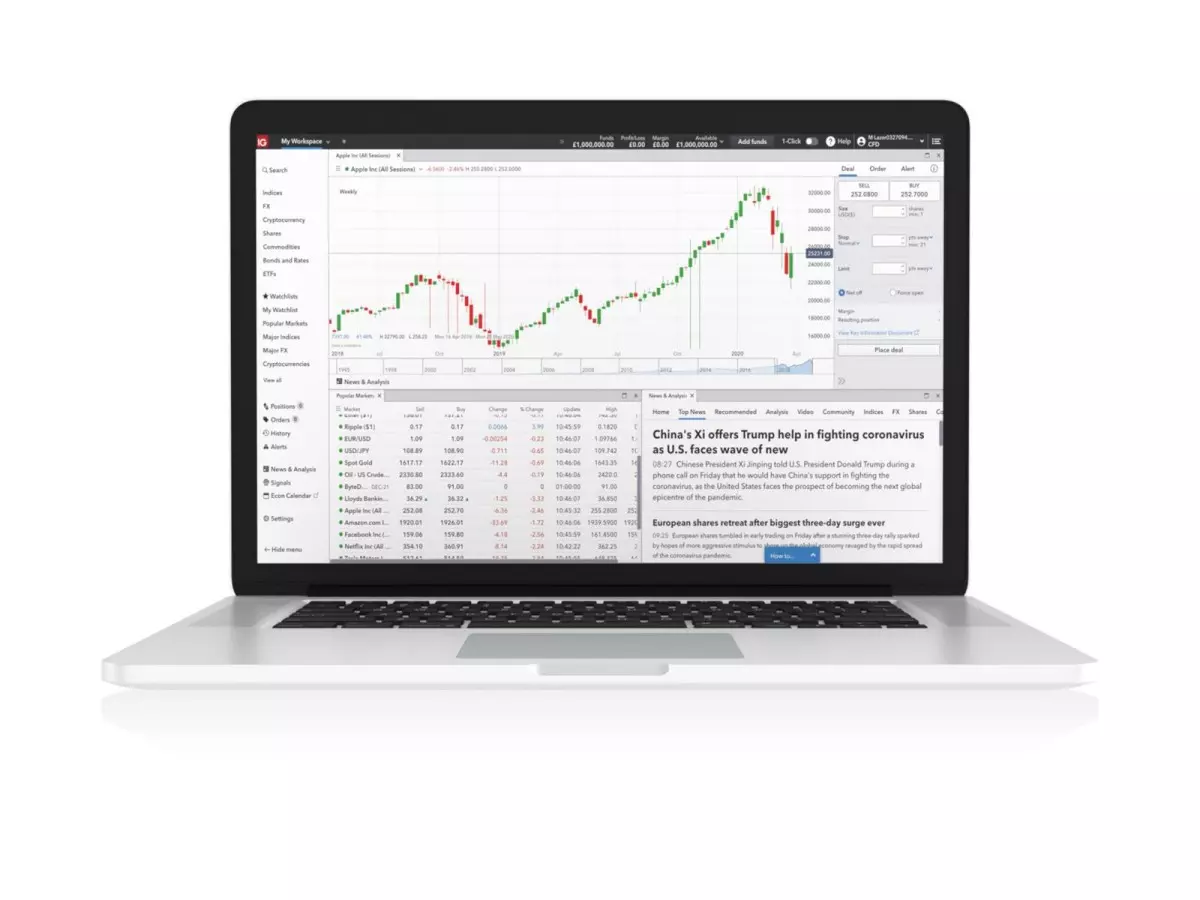
Access top-quality charts and key indicators for over 17,000 markets. Make informed decisions with the best trading platform2 – a faster, clearer and smarter way to trade.
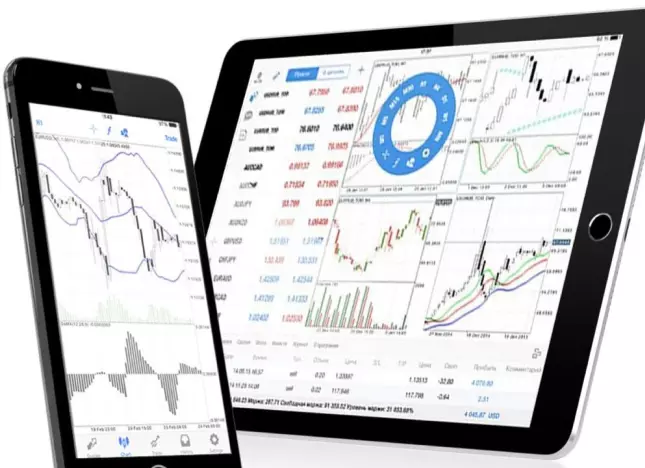
Mobile trading app
Charts on the go, wherever you are, whenever you want. Access thousands of markets – including stocks, forex, cryptos and indices – with the UAE’s best trading app.2
Mobile trading app
Analyse the markets and customise your MetaTrader 4 experience with our range of free indicators and add-ons.
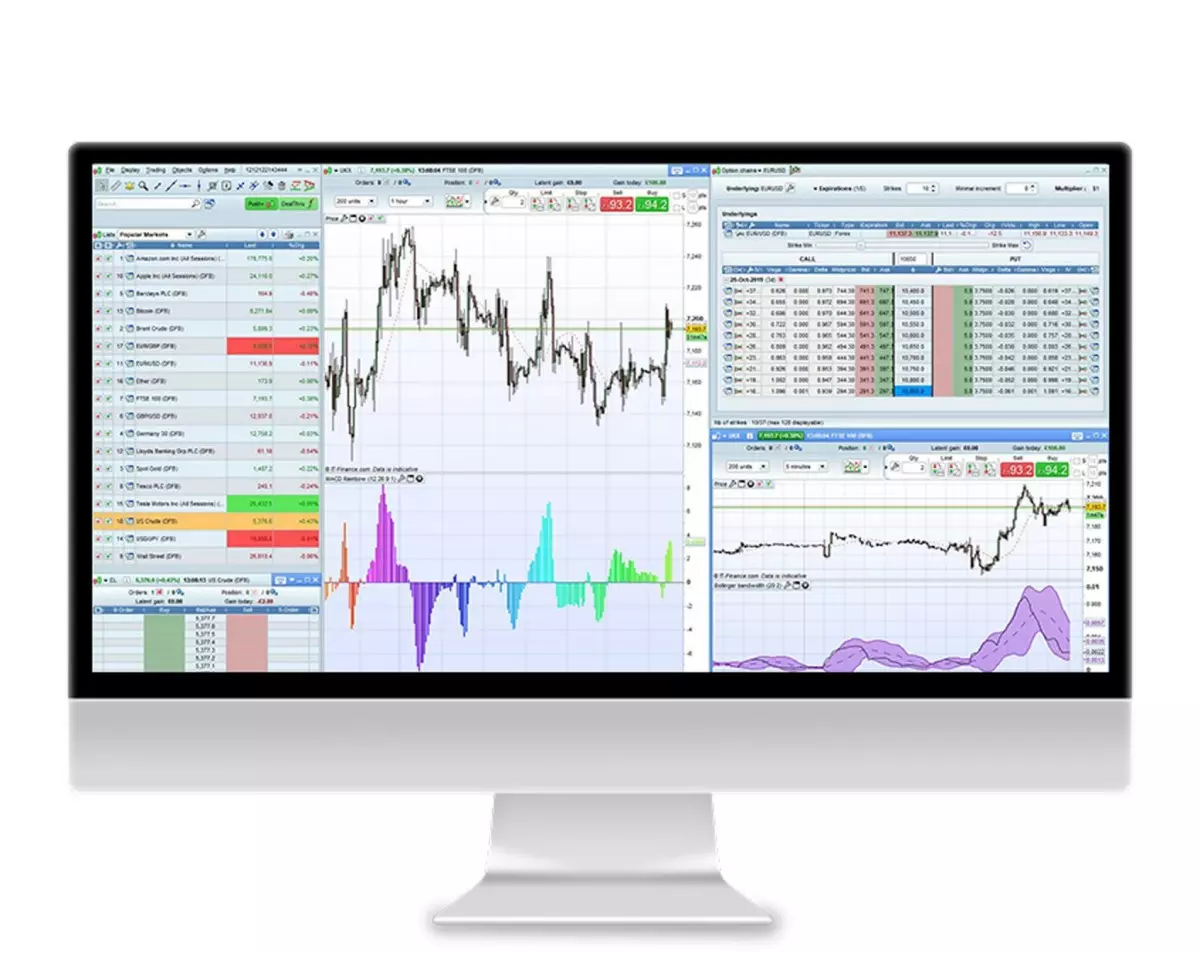
ProRealTime
Perform expert market analysis and automate your trading with the leading web-based charting package, ProRealTime.
The best charts for trading are those that offer you the information you need to form an interpretation of the market. We offer five different price chart views.
For beginners, line and mountain charts are uncluttered and show price movements clearly. For more experienced traders, candlestick and HLOC charts are useful to gauge price volatility and the pace of change across the shorter term. Heikin-Ashi charts are suited to experienced traders looking for general price movements and trends over longer periods of time.
Where can I get free trading charts?
You can get free trading charts in our award-winning platform.[3] You can try our free demo account and get $10,000 in virtual funds to practise with. You can also create a live trading account. There’s no requirement to fund a live account, so you don’t have to trade until you want to.
What indicators can I use for technical analysis on charts?
With us, you can choose from 25 popular indicators to use for your technical analysis. We also offer 17 drawing tools for you to help visualise important patterns and trends.
Try these next
MT4 indicators and add-ons
Perform technical analysis and customise your MT4 platform with free indicators and add-ons.
Trading signals
Learn more about using our trading signals so that you never miss an opportunity.
ProRealTime
Find out how you can use the ProRealTime to perform advanced analysis, and automate your trading.
1 Based on revenue (published financial statements, 2023). 2 All chart prices are indicative of IG prices, and not necessarily those of an exchange or third-party broker-dealer. 3 Best Finance App, Best Multi-Platform Provider and Best Platform for the Active Trader as awarded at the ADVFN International Financial Awards 2024. 4 There are 10 hours of no trading, depending on the asset class being traded. For more details refer to our out-of-hours trading page.